Vector Map
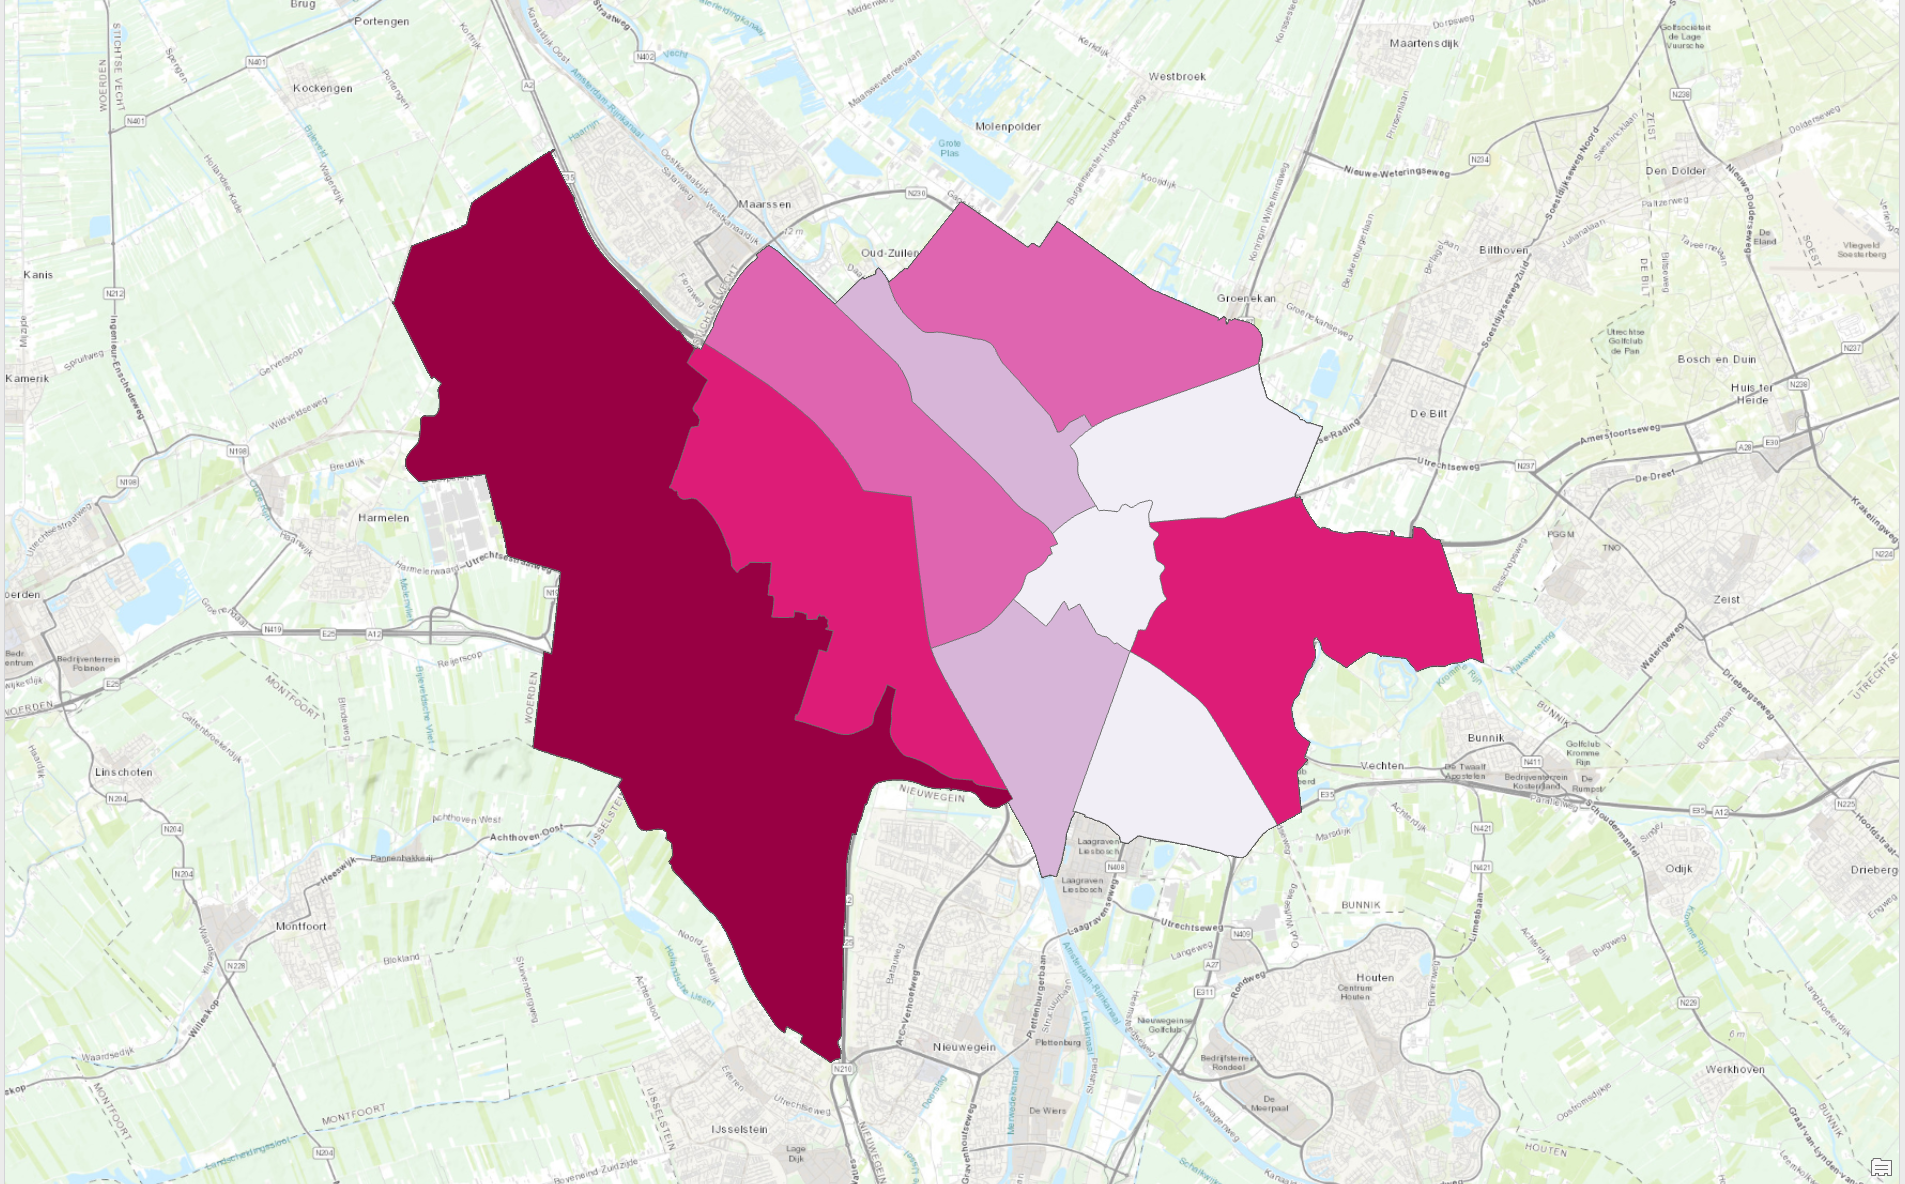
This is a choropleth map I made using vector data of the rate of all trees in Utrecht. The map shows the common hawthorn amounts in different neighbourhoods of utrecht.
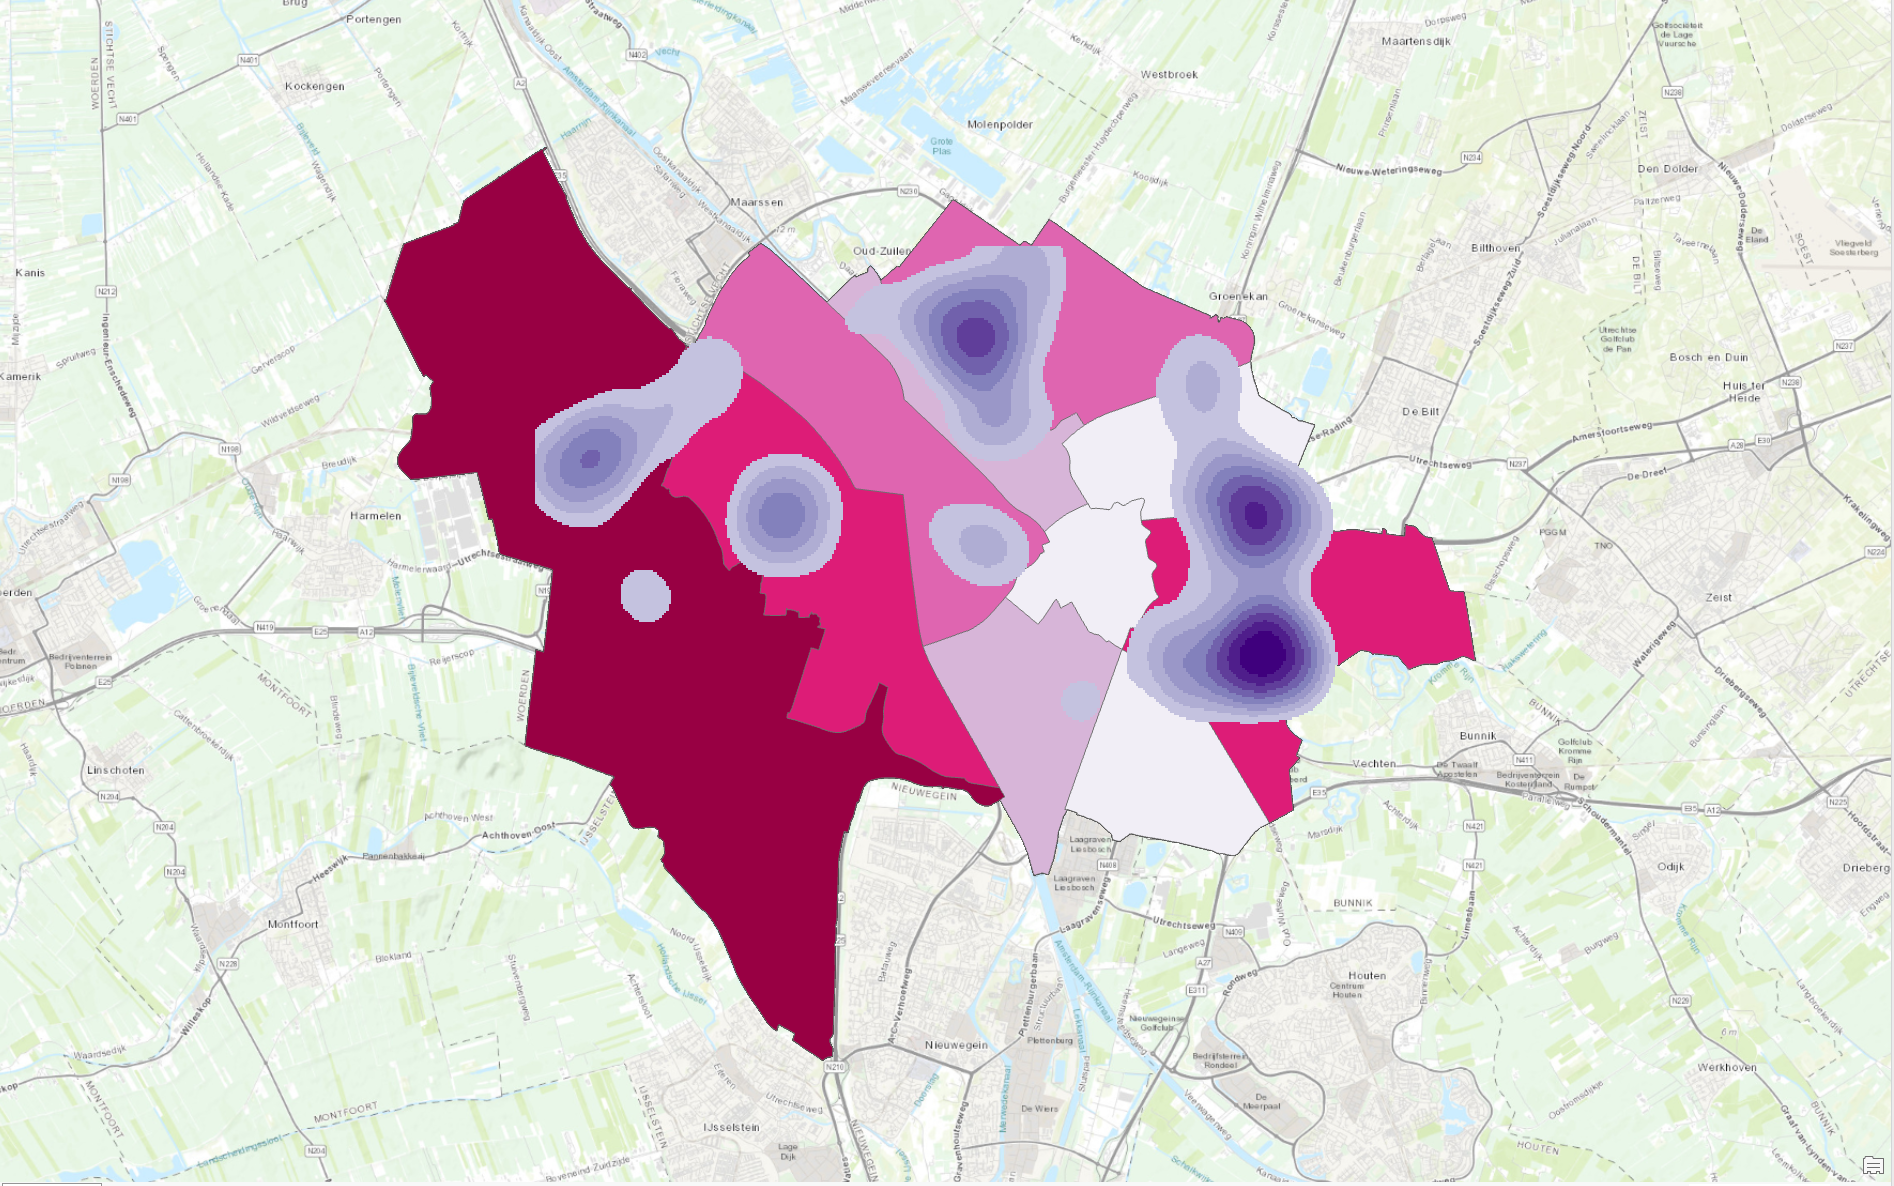
This shows the kernel density of hawthorns in Utrecht.
This is a choropleth map I made using vector data of the rate of all trees in Utrecht. The map shows the common hawthorn amounts in different neighbourhoods of utrecht.
This shows the kernel density of hawthorns in Utrecht.